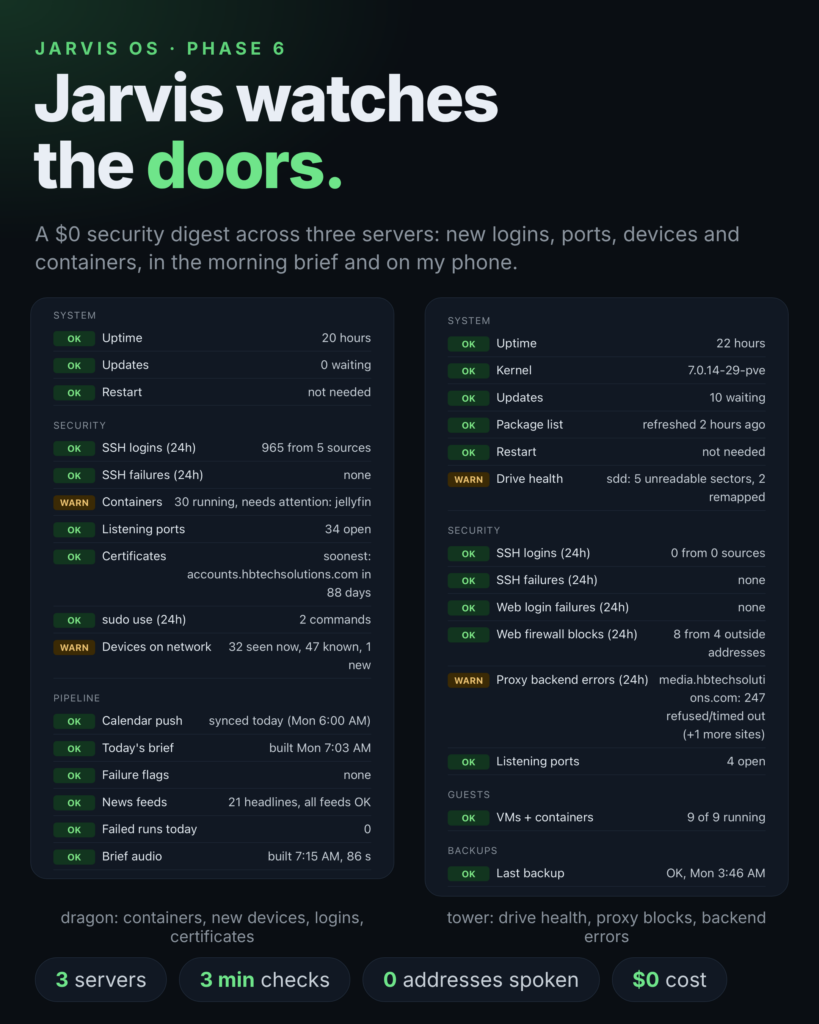
My JARVIS OS started as a morning brief. By Phase 5 it was a live dashboard for three servers and a dozen virtual machines. Phase 6 gives it a job I’d been putting off: telling me when something looks wrong from a security point of view, before I open my laptop.
Where this came from
After I posted Phase 2, a reader commented that the brief should flag security events: failed logins, exposed services, pending patches, unusual traffic. “Tell me what needs my attention before I open my laptop.” I wrote it down, and Phase 6 is the answer.
The constraint: no new plumbing
Every earlier phase uses the same pipeline. Each server runs a small Python script, the scripts write a JSON report, and my dashboard draws a card from it. Problems become one phone ping per new issue. Security checks plug into that same path, so the dashboard, the ping and the spoken line all worked on day one without new infrastructure.
Stage 1: the servers
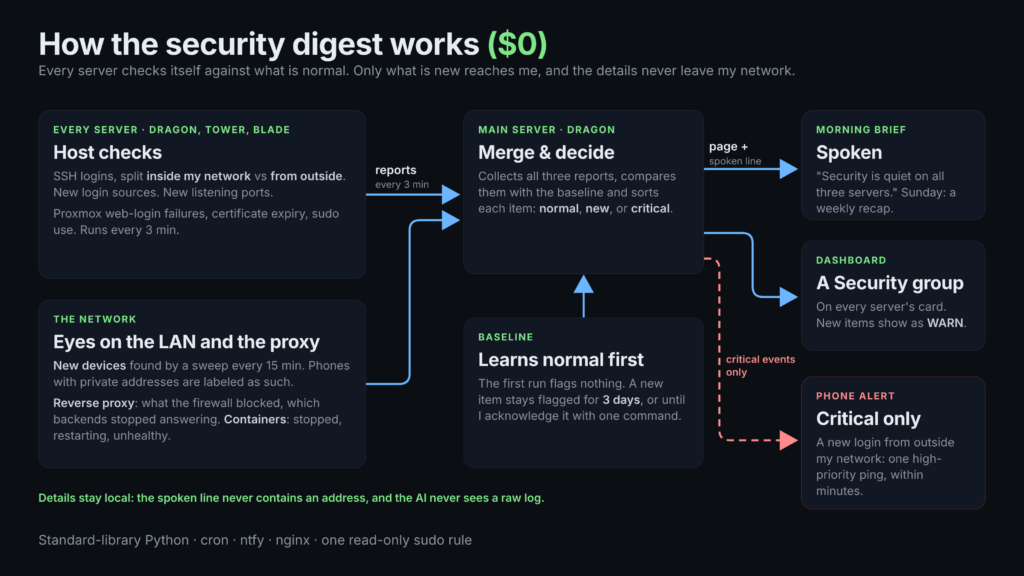
On every machine, a security module collects:
- SSH logins, split into “from inside my network” and “from outside,” plus failed attempts in the last 24 hours
- New login sources: an account logging in from somewhere it never has
- New listening ports
- Failed logins to the Proxmox web interface
- TLS certificate expiry for my public sites, warning at 21 days and critical at 7
- How often sudo was used
The key idea is a baseline. The first run learns what is normal and flags nothing. After that, any new port or login source is flagged for three days, which is long enough for me to notice and decide. Then it becomes normal.
Stage 2: the network
Three additions:
- Device discovery. Every 15 minutes the dragon server sweeps its own subnet and reads its neighbor table. A device it hasn’t seen before is flagged, and phones using a private Wi-Fi address are labeled as such, so a new phone doesn’t look like an intruder.
- Reverse-proxy digest. My public sites sit behind a reverse proxy with a web firewall. The digest counts what the firewall blocked and which backends stopped answering, and shows only the totals.
- Container watch. Anything that was running and stopped, keeps restarting, or reports unhealthy gets flagged. It runs through one narrow, read-only sudo rule rather than giving the script full Docker access.
One thing I cut: DNS anomaly detection. I’d planned it until I realized my router gives every device its own DNS. My filtering servers only see traffic from my VPN, so a check on them would have told me almost nothing about the house.
Stage 3: Jarvis says it out loud
- The spoken brief ends with “Security is quiet on all three servers,” or says how many items are open. It only says “quiet” when the checks really ran on all three machines. A silent failure should never sound like good news.
- Critical events, such as a login from outside my network, trigger a high-priority phone ping within minutes. Each event pings once, and the morning run doesn’t repeat it.
- On Sundays there’s a recap: how many days were quiet, and which kinds of items came up, with no addresses spoken.
Privacy rules I set for myself
- Details stay local. The spoken line never contains an address.
- The AI that writes the brief never sees a raw log. It gets the checks’ summaries, not the data behind them.
- Nothing gets more access than it needs.
What the first week caught
- A Docker container had been crash-looping for six days. It was a leftover duplicate of a service that was already running another way. The container watch showed it on the dashboard until I removed it.
- Jellyfin’s ports were flagged as new, because the baseline was learned while Jellyfin was down after a restart. That also exposed a gap: the same restart had left Jellyfin stopped for about three days with nothing telling me. A week later it happened again after another reboot, and this time the container watch put “needs attention: jellyfin” on the dashboard that morning. I’m still tracing why it doesn’t start on its own after a reboot, so that’s a future post.
- A new phone joined the Wi-Fi, and the ping reached my phone within the sweep interval.
- While tracing a flaky backup, I found one of my server’s drives reporting unreadable sectors. The server’s own disk monitor had logged it, not my new digest, and nothing on my dashboard showed it. That led to a drive-health row on every server’s card, with a trend, so a count that starts growing becomes a critical alert instead of a log line.
Mistakes worth sharing
- My live dashboard refreshes every few minutes, so it showed a red “brief missing” at 3 AM. The brief isn’t built until 7. I added grace windows: “not built yet” before it’s due, a real failure only after.
- A test of the device sweep returned nothing because of how the neighbor table is read. The command prints slightly different lines than I expected. I rewrote the parser to read all interfaces and filter afterward.
What it costs
Nothing. It’s standard-library Python on machines I already had, and the phone pings go through a self-hosted notification server.
What’s next
Candidates: alerts when a meeting moves, my family calendar, and a way to simply ask Jarvis a question. As always, the next phase gets picked based on what annoys me most.