By Part 11, the Data Center in a Bag had become a lot more than a single Proxmox laptop.
The travel kit now includes:
- Proxmox
- pfSense
- AdGuard
- Firezone
- Linux VMs and containers
- Docker workloads
- Minecraft servers
- FUTO Notes
- Kali Linux
- an isolated pentest lab
- external backup storage
At that point, one problem started becoming obvious:
I had enough services running that manually checking everything was no longer practical.
So Part 11 became about monitoring.
Starting Fresh with Uptime Kuma
I originally thought Uptime Kuma was already running on the Ubuntu Docker VM.
It was not.
So this part started completely from scratch.
I deployed Uptime Kuma through Portainer using Docker Compose and exposed it on:
http://10.20.20.20:3001
The first deployment initially used the older v1 image, but after seeing the deprecation warning, I updated the stack to use the current v2 image.
The final container configuration kept the Uptime Kuma database persistent so the monitoring configuration would survive container rebuilds.
Building the First Monitoring Layer
The first goal was simple:
Can I tell whether the important systems are alive?
I created ping monitors for the main infrastructure systems:
Proxmox 192.168.8.10
pfSense 10.20.20.1
AdGuard 10.20.20.2
Ubuntu Docker 10.20.20.20
Each monitor checks the system at roughly 60-second intervals.
This gives me a quick infrastructure-level view.
If one of those systems disappears from the network, I can immediately see it on the dashboard.
Host Monitoring vs. Service Monitoring
One of the useful lessons from this setup was the difference between checking whether a machine is alive and checking whether the actual application is working.
A ping only proves the host responds.
It does not prove that Proxmox, pfSense, or another service is actually usable.
So I built a second monitoring layer using HTTP and HTTPS checks.
Examples include:
Proxmox WebUI
https://192.168.8.10:8006
pfSense WebUI
https://10.20.20.1
Uptime Kuma
http://10.20.20.20:3001
Because Proxmox and pfSense use internal/self-signed certificates in the lab, the monitors were configured to accept those certificates.
This gave me two distinct checks:
Ping
“Is the machine alive?”
HTTP/HTTPS
“Is the actual service responding?”
That distinction matters.
A server can be reachable while the application running on it is still down.
Expanding the Dashboard
Once the infrastructure checks were working, I added more of the services running inside the travel kit.
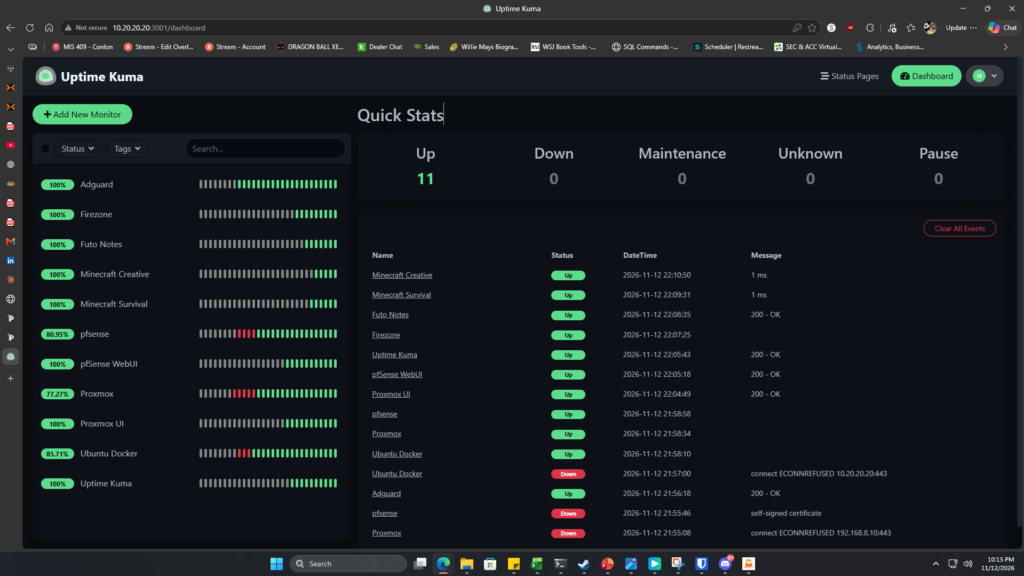
The monitoring dashboard eventually grew to cover:
- Proxmox
- Proxmox WebUI
- pfSense
- pfSense WebUI
- AdGuard
- Ubuntu Docker
- Uptime Kuma
- Firezone
- FUTO Notes
- Minecraft Survival
- Minecraft Creative
At this point, the dashboard gives me a quick visual overview of most of the important components in the portable environment.
Instead of SSHing into multiple systems or opening several browser tabs, I can look at one dashboard and immediately see whether the environment is healthy.
Monitoring Minecraft
The two Minecraft Bedrock environments also became part of the monitoring setup.
The travel kit currently hosts separate Survival and Creative servers.
Monitoring them adds another useful layer because the Docker host itself could still be up while one of the Minecraft services is unavailable.
That is exactly why service-level monitoring is useful.
Adding Discord Alerts
A monitoring dashboard is useful, but only if I remember to look at it.
The next step was notifications.
I initially looked at using Signal, but the Signal integration would have required running an additional API service.
For a portable lab, I wanted something simpler.
I chose a Discord webhook.
The webhook was connected directly to Uptime Kuma, giving the monitoring system the ability to push alerts to a dedicated Discord channel when a monitored service changes state.
This means I no longer have to actively watch the dashboard.
If something goes down, the monitoring system can tell me.
Avoiding Duplicate Alerts
I also decided not to alert on every single monitor.
For example, a Proxmox host outage could cause both the ping monitor and the WebUI monitor to fail.
Alerting on both could create unnecessary duplicate notifications.
Instead, the plan is to prioritize service-level alerts for the systems that matter most while still keeping the ping monitors visible on the dashboard for troubleshooting.
This keeps the alerts useful instead of noisy.
What Part 11 Added
The Data Center in a Bag now has:
- centralized monitoring
- host availability checks
- application-level monitoring
- web service health checks
- monitoring for infrastructure and hosted applications
- a single dashboard for the environment
- Discord notifications for outages
The project is starting to move from simply building infrastructure into actually operating it.
Earlier parts focused on questions like:
Can this laptop run all of this?
Now the questions are changing:
Is everything healthy?
What failed?
Will I know when it fails?
That is a very different stage of the project.
The Data Center in a Bag is no longer just a collection of VMs, containers, and network services.
It now has visibility into its own health.