Phase 5 of my “JARVIS OS” project: per-VM monitoring and a dashboard that updates itself.
For four phases my homelab assistant told me how my servers were doing once a day. That’s useful, but it’s a report, not a watch. Phase 5 changes that: it looks inside every virtual machine and container on my two Proxmox hosts, shows what it finds on a page that refreshes itself, and pings my phone within minutes when something stops.
What it does
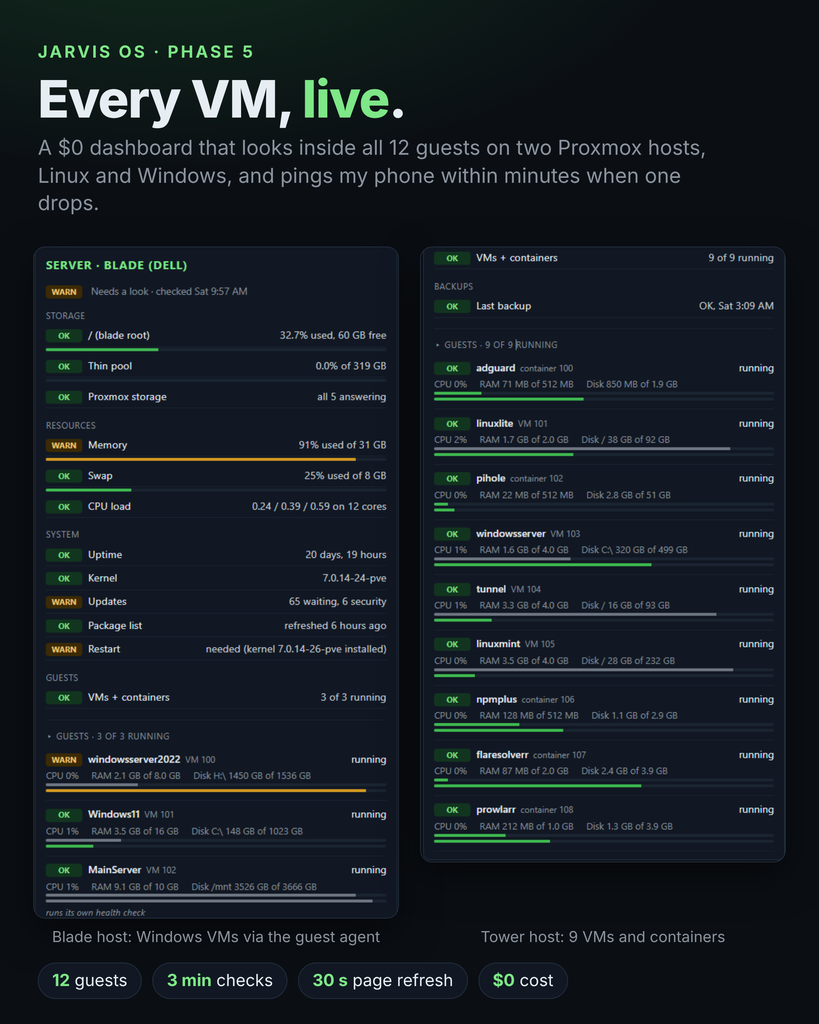
- Looks inside every guest. Twelve VMs and containers across two hosts, Linux and Windows, each with CPU, memory and disk. Windows reports through the QEMU guest agent, so it shows real drives, not just allocated size.
- Refreshes every 3 minutes. Each host re-checks the fast things (storage, memory, load, guests) and sends the result to my main server. The slow, apt-based checks (pending updates, restarts) still run once a day.
- Updates the page in place. The dashboard on my phone fetches fresh data every 30 seconds and swaps it in. A small line under the title says “live, updated 10 s ago” and turns grey if the page can’t reach the server. If I’ve opened a guest list, it stays open.
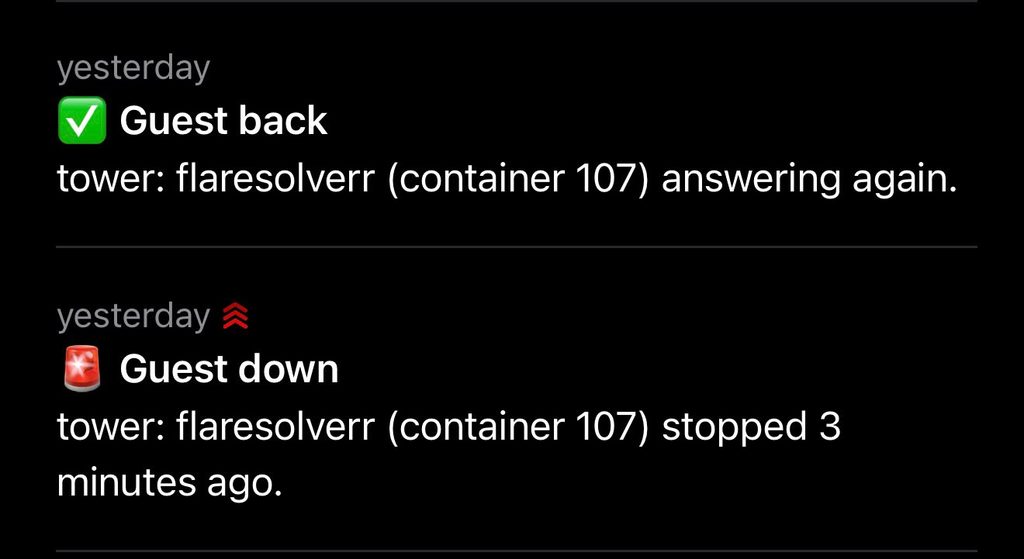
- Pings me when a guest goes down. If a guest that was running stops for two checks in a row, I get one phone alert, and one more when it comes back. A VM whose guest agent used to answer and then goes silent for about 15 minutes gets its own alert, because a frozen OS still looks “running” to the hypervisor.
- Retries failed backups. After the nightly job, a script looks for guests that failed and re-runs just those. It hasn’t had to do anything yet.
The stack (still free)
- Python, standard library only, run by cron
- The QEMU guest agent that ships with Proxmox (plus virtio-win-guest-tools on Windows)
- SSH keys on each host that can only write that host’s report
- A free notification service for the phone alerts, with a second public channel for the “main server is down” case
- The same read-only page, reachable only on my LAN and VPN
The tests that mattered
I stopped a container on purpose. The card turned red without a reload, the ping arrived a few minutes later, and when I started it again the card went green and a second ping said it was back. Everything else is theory until you’ve watched it fail once.
What went wrong along the way
A disk at 100% that wasn’t
One Windows VM showed a full disk. It was an installer ISO sitting in the virtual DVD drive. Disk checks should ignore optical drives, or you’ll chase a problem that isn’t there. The one real warning that remained was a 1.6 TB data drive at 94%.
Cron has a shorter PATH than your terminal
The new scripts worked perfectly when I ran them by hand. Once cron ran them, every VM said “no guest agent.” The command that asks the agent lives in a folder cron doesn’t search, so it quietly got no answer. The same bug would have broken the backup retry the first night it was needed. The fix is one line at the top of each script, and the test is to run it with env -i PATH=/usr/bin:/bin before scheduling it.
Backups that failed for no visible reason
Two nightly backups failed, on different VMs, on different nights, with the same terse error and nothing in the logs on either end. I could have kept digging. I added a retry instead, because the cost of finding a one-off network blip was higher than the cost of surviving it. Old backups are only deleted after a new one succeeds, so a failure never removes the last good copy.
A red card that stayed red
A single failed morning left a “failure flag” file that kept the dashboard red the next day. Flags older than yesterday now age out on their own, and the files stay put in case I want the evidence.
What it costs
Nothing. The scripts, the agent, the alerts and the hosting all run on hardware I already own.
What’s next
- A live card for the main server too, so all three refresh together.
- A maintenance night for pending kernel updates, with the alerts paused first.
- Shrinking VM memory allocations now that I can see real peak use.
- Then calendar-change alerts, and eventually a phone-call version of the brief.
If you want a cleaned-up copy of the scripts, get in touch.